Lecturer
Prof. John Boland, University of South Australia
Synopsis
The use of statistical and time series techniques in examining the characteristics of climate variables, and forecasting future values in series of these variables, gives a significant amount of information to policy makers. I am excited to be able to convey the techniques I have used in this area in conjunction with instrumentalities like the Australia Energy Market Operator, the Bureau of Meteorology, the Murray Darling Basin Commission, the Australian Energy Market Commission, and the International Energy Agency.
In the National Electricity Market (NEM) in Australia, short term forecasting is an important endeavour. Every five minutes, conventional generator companies submit a bid stack, that is the electrical energy they can supply to the grid at a number of price bands. Solar and wind farms over 30 MW capacity also submit a forecast of output. The Australian Energy Market Operator (AEMO) then runs a linear program to see how far up the bid stacks they have to go to supply their forecasted load. This then determines the spot price for electricity.
Renewable energy, in the form of wind and solar, is becoming a significant contributor to the electricity supply mix. For example, in South Australia, over 70% of electricity in supplied by the combination of wind and solar farms, coupled with rooftop solar. In this course we will examine statistical tools to forecast output from wind and solar farms at these time scales. In particular, we will study how to not only forecast the expected wind or solar farm output but also put error bounds on those predictions.
We will also study the three components of solar radiation, global or total, direct and diffuse, the diffuse radiation being that which is received at a location after being scattered by particles in the atmosphere.
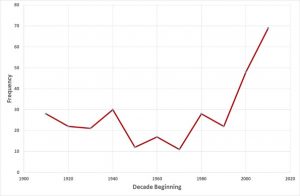
The prevailing wisdom is that the changes in rainfall totals over time are linked to climate change, and there is substantial evidence in the literature to support this view. However, there is also literature to support the thesis that some of the change can be attributed to land use change. We will examine some of the trends and also try to look at the contributions of the two factors. Aligned with this, we will also examine some local trends and changes in distribution in temperature, and their implications. When examining effects of climate change on temperature, it is usually mentioned that an increase of 1.5 or 2 degrees on average will result in huge consequences. However, looking at extremes gives, in my opinion, a more poignant view – see the increase in number of days per decade over 40o in Adelaide.
This will be a very practical course, with the theory developed through examination of how to deal with analysis of real data sets, solar radiation, output from solar and wind farms, rainfall and temperature.
Course Overview
Week 1: Introduction to time series analysis. We will deal with seasonality, using both simple techniques and Fourier analysis. Included in this will be a discussion on pitfalls, including aliasing. In this segment, we will explore using Fourier series for describing seasonality of solar radiation series versus using a Clear Sky Model to derive clear sky indices (CSI). We will also examine both moving average and exponential smoothing, especially for trend analysis in noisy data.
Week 2: Forecasting methods will be studied. The focus will be on Box-Jenkins or Autoregressive Moving Average (ARMA) modelling. However, we will also examine artificial neural networks (ANN), mainly as a comparison with ARMA.
Week 3: Probabilistic forecasting. Methods will include Autoregressive Conditional Heteroscedastic (ARCH) and Generalised ARCH or GARCH, quantile regression, and an innovation of GARCH using a normalising transformation.
Week 4: There will be two separate topics in this week. One will be trend and change point analysis of rainfall and temperature due to climate and land use change, specifically with some South Australian examples. This will also include changes in distribution, as well as the trend. The other topic will be a discussion of the Boland-Ridley-Lauret (BRL) diffuse solar radiation model and its descendants. The BRL model was developed to predict diffuse horizontal solar radiation from the more widely available global horizontal radiation. This model has become the basis for any developments in so-called transposition models in the last decade.
Prerequisites
- Methods of frequentist statistical decision making
This is a foundational course, in the sense that I will be assuming that the students will have knowledge of statistical decision making, but will not have studied time series analysis per se. The other aspect is that it will focus specifically on the analysis of climate data.
Assessment
- 4x Weekly assignments
- Assignments 1-3 – 20% each
- Assignment 4 – 10%
- Take home examination (to be completed over two days during the exam period) – 30%
Attendance requirements
TBA
Resources/pre-reading
- If you need to refresh your simple stats knowledge, you can access Statistics for Technology (Third Edition (Revised)): A Course in Applied Statistics: A Course in Applied Statistics, Third Edition: 3 by Chris Chatfield or similar.
- If you would like to brush up on time series, you can look at The Analysis of Time Series by Chris Chatfield.
Not sure if you should sign up for this course?
Take this QUIZ to self-evaluate and get a measure of the key foundational knowledge required.

Prof. John Boland, University of South Australia
John Boland is Professor of Environmental Mathematics and Deputy Director of the Industrial AI Research Centre at the University of South Australia.
Professor Boland has published over 200 academic papers, approximately half of which are co-authored by various PhD students. His research covers a wide range of areas in what can be termed environmental mathematics, from water resource management to renewable energy utilisation to energy efficient house design to environmental accounting. His work on short term solar forecasting has resulted in his being part of the International Energy Agency Task 16 on solar forecasting for high penetration of solar energy. He is a Fellow of the Modelling and Simulation Society of Australia and New Zealand, and of the Australian Institute of Energy.


